
Medical Risk Calculator: Absolute vs. Relative
Risk if NOT taking the drug (Baseline)
Risk while taking the drug
Visualizing Absolute Risk (Control Group)
Each red square represents 1 person affected out of 100.
Imagine you're reading a medical brochure that says a new medication reduces the risk of a heart attack by 50%. Your first instinct is probably to think, "Wow, that's a huge improvement!" But here is the catch: does that mean your personal risk drops from 10% to 5%, or from 0.2% to 0.1%? Depending on the answer, the drug is either a life-changer or a statistical curiosity. This is the gap between Absolute Risk and Relative Risk. Understanding the difference is the only way to truly know if a side effect is a deal-breaker or if a benefit is actually worth the pill.
The Basics: What Are We Actually Measuring?
When scientists track side effects or benefits, they use two different lenses to look at the data. One tells you the big picture, and the other tells you the specific chance of something happening to you.
Absolute Risk is the most straightforward metric. It is the actual probability of an event occurring in a specific group of people. If 100 people take a drug and 5 of them develop a rash, the absolute risk is 5%. It's a raw number that doesn't care about any other group; it just tells you the frequency of the event.
On the other hand, Relative Risk (RR) is a comparison. It looks at the risk in one group (people taking the drug) and divides it by the risk in another group (people taking a placebo). If the drug group has a 2% risk of a side effect and the placebo group has a 1% risk, the relative risk is 2.0. This means people taking the drug are twice as likely to experience that side effect. It doesn't tell you how common the effect is, only how much more common it is compared to the alternative.
Why the Numbers Often Feel Misleading
You've probably noticed that pharmaceutical ads love percentages. They often highlight Relative Risk Reduction (RRR) because the numbers look much more impressive. Let's look at a real-world scenario to see why this happens.
Suppose a drug for a rare condition reduces the chance of a complication from 2% (in the control group) down to 1% (in the treatment group). Mathematically, that's a 1 percentage point difference. But in marketing speak, that is a 50% relative risk reduction. By focusing on the relative drop (1% is half of 2%), the benefit seems massive. However, the Absolute Risk Reduction (ARR) is only 1%. For most people, the difference between a 2% risk and a 1% risk is negligible, but "50% reduction" sounds like a miracle cure.
| Scenario | Control Group Risk | Treatment Group Risk | Absolute Risk Reduction (ARR) | Relative Risk Reduction (RRR) |
|---|---|---|---|---|
| Heart Attack Risk | 2% | 1% | 1% | 50% |
| Severe Infection | 0.1% | 0.01% | 0.09% | 90% |
| Common Headache | 20% | 10% | 10% | 50% |
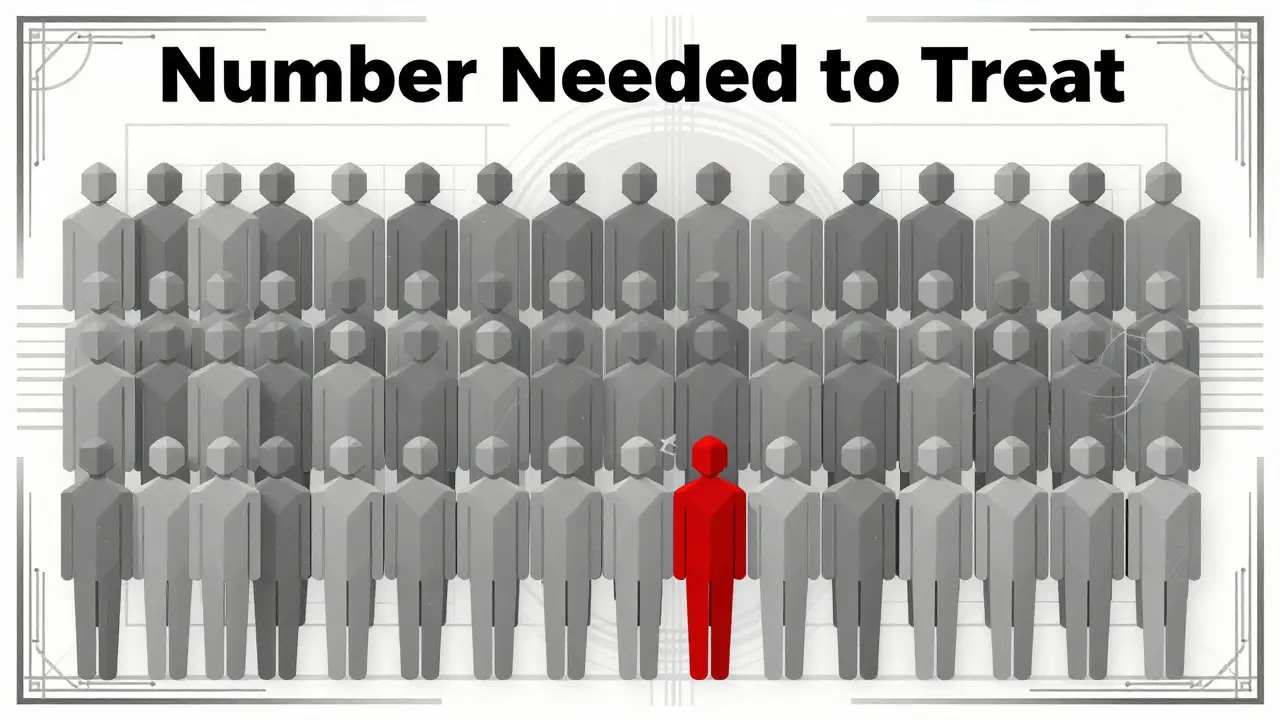
The Hidden Tool: Number Needed to Treat (NNT)
If you're still struggling to visualize what these percentages mean for your health, there's a better metric: the Number Needed to Treat (NNT). This tells you how many people need to take the drug for one person to actually benefit (or avoid a side effect).
The formula is simple: NNT = 1 / ARR (expressed as a decimal). Using our previous heart attack example where the ARR was 1% (0.01), the NNT is 1 / 0.01 = 100. This means 100 people must take the drug for one person to avoid a heart attack. Now, ask yourself: is it worth 100 people risking a potential side effect so that one person avoids a heart attack? When you put it this way, the "50% reduction" suddenly feels much less urgent.
Spotting "Statistical Deception" in Drug Marketing
It is a common tactic in the pharmaceutical industry to use relative risks to inflate benefits and absolute risks to downplay side effects. Think about it: if a drug increases the risk of a rare liver issue from 0.001% to 0.002%, a company might say the risk is "extremely low" because 0.002% is barely anything. But if they wanted to scare competitors, they'd say the drug "doubles the risk" of liver failure (a 100% relative increase).
Experts from the Dartmouth Institute for Health Policy & Clinical Practice have pointed out that absolute numbers are the only way to determine the true size of a benefit. When you see a percentage in a headline, always ask: "Relative to what?" If the headline says "risk reduced by 30%," you need to find the baseline risk. If the baseline risk is 0.1%, a 30% drop is almost meaningless. If the baseline is 40%, it's a massive discovery.
How to Talk to Your Doctor About These Numbers
Most people-and surprisingly, many doctors-struggle to convert these numbers on the fly. When your provider suggests a new medication, don't just accept the percentage. Use these specific questions to get the clarity you need:
- "What is the absolute risk of this side effect happening to me?"
- "If I don't take this drug, what is my baseline risk for the condition?"
- "How many people typically need to take this drug before one person sees a real benefit?"
- "Is that percentage a relative change or an absolute change?"
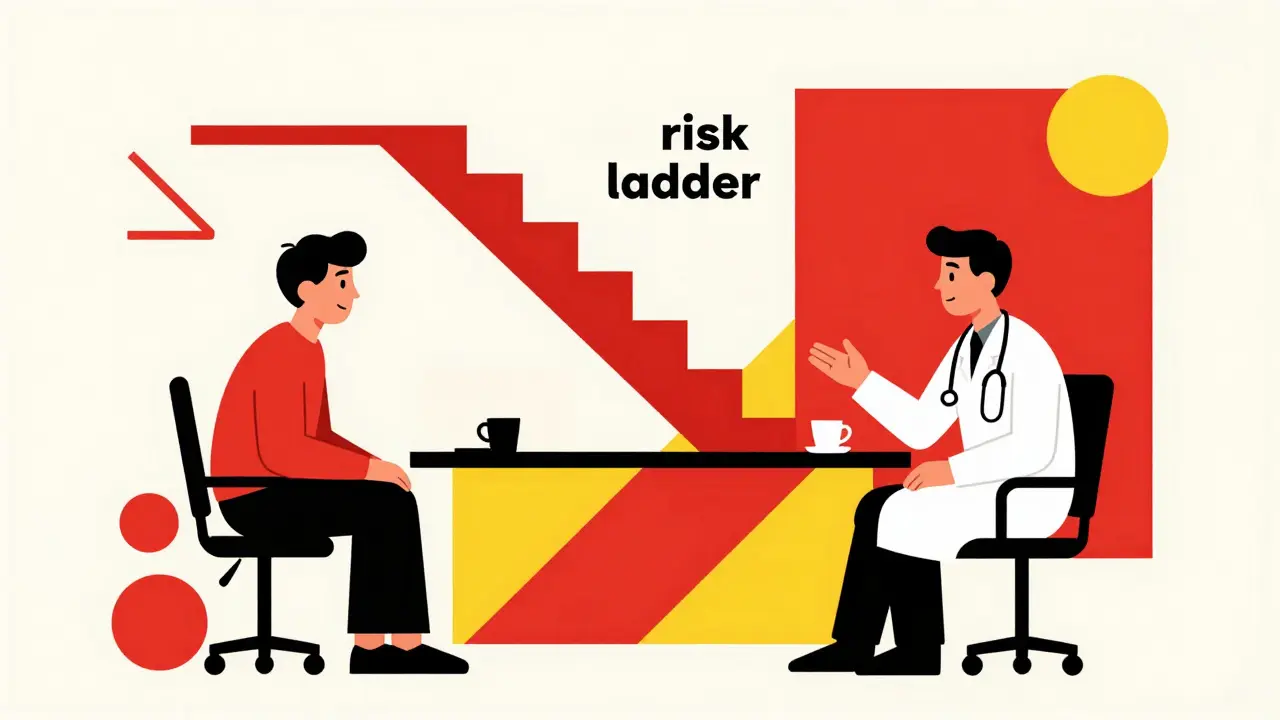
A helpful way to visualize this is to ask for a "risk ladder" or a pictogram. If your doctor can show you a grid of 100 people and color in how many would actually be affected, the math becomes a visual reality. Seeing one red square out of 100 is much more intuitive than hearing "a 1% absolute risk."
The Bottom Line on Interpreting Risk
Relative risk is great for scientists who want to know if a drug is working at all. It standardizes results across different groups. But for a patient, relative risk is an incomplete story. It tells you the direction of the change, but not the magnitude of the impact.
To make an informed decision, you need both. Relative risk gives you the "wow" factor, but absolute risk gives you the "so what?" factor. Next time you see a medical claim, look past the big percentages and hunt for the raw numbers. That is where the truth actually lives.
Why do pharmaceutical companies prefer relative risk over absolute risk?
Relative risk usually produces a much larger number. For example, moving a risk from 2% to 1% is only a 1% absolute difference, but it's a 50% relative reduction. Larger numbers are more persuasive in marketing and make the drug appear more effective than it might be in a practical, everyday sense.
If a drug has a Relative Risk (RR) of 1.0, what does that mean?
An RR of 1.0 means there is no difference in risk between the treatment group and the control group. If the RR is greater than 1.0, the risk is higher in the treatment group; if it's less than 1.0, the risk is lower.
What is the easiest way to explain Absolute Risk Reduction (ARR) to a patient?
The easiest way is to describe it as the actual percentage point difference. For instance, instead of saying "risk was reduced by 50%," say "the risk went from 2 in 100 people down to 1 in 100 people." Using whole numbers (like 1 in 100) is generally easier for people to visualize than percentages.
Is relative risk ever more useful than absolute risk?
Yes. Relative risk is very useful for researchers to identify risk factors or determine if a treatment has any effect at all across different populations with different baseline risks. It tells you the strength of the association between the drug and the outcome, regardless of how rare the outcome is.
How do I calculate the Number Needed to Treat (NNT)?
First, find the Absolute Risk Reduction (ARR) by subtracting the treatment group risk from the control group risk. Then, divide 1 by that decimal. For example, if the ARR is 5% (0.05), the NNT is 1 / 0.05 = 20. This means 20 people need to be treated for one person to experience the benefit.